Which US State Is the Greenest? A Data‑Driven Ranking for 2025
 Oct, 9 2025
Green State Index Calculator
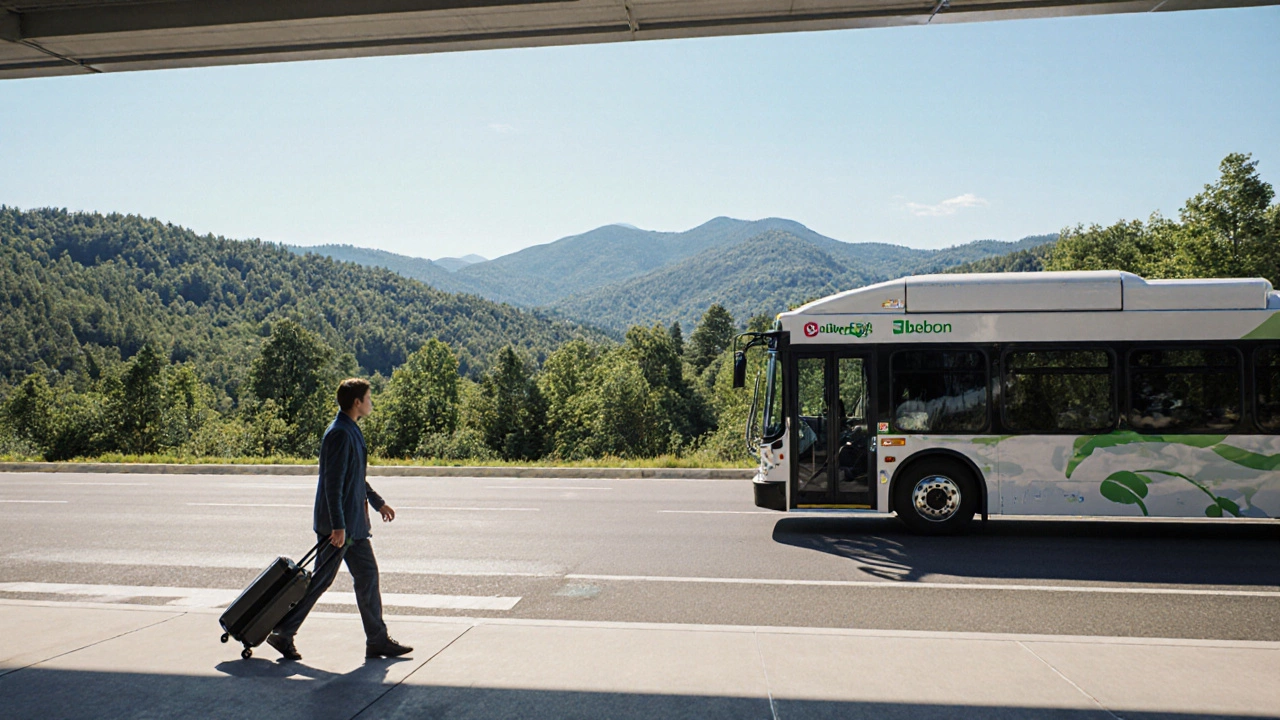
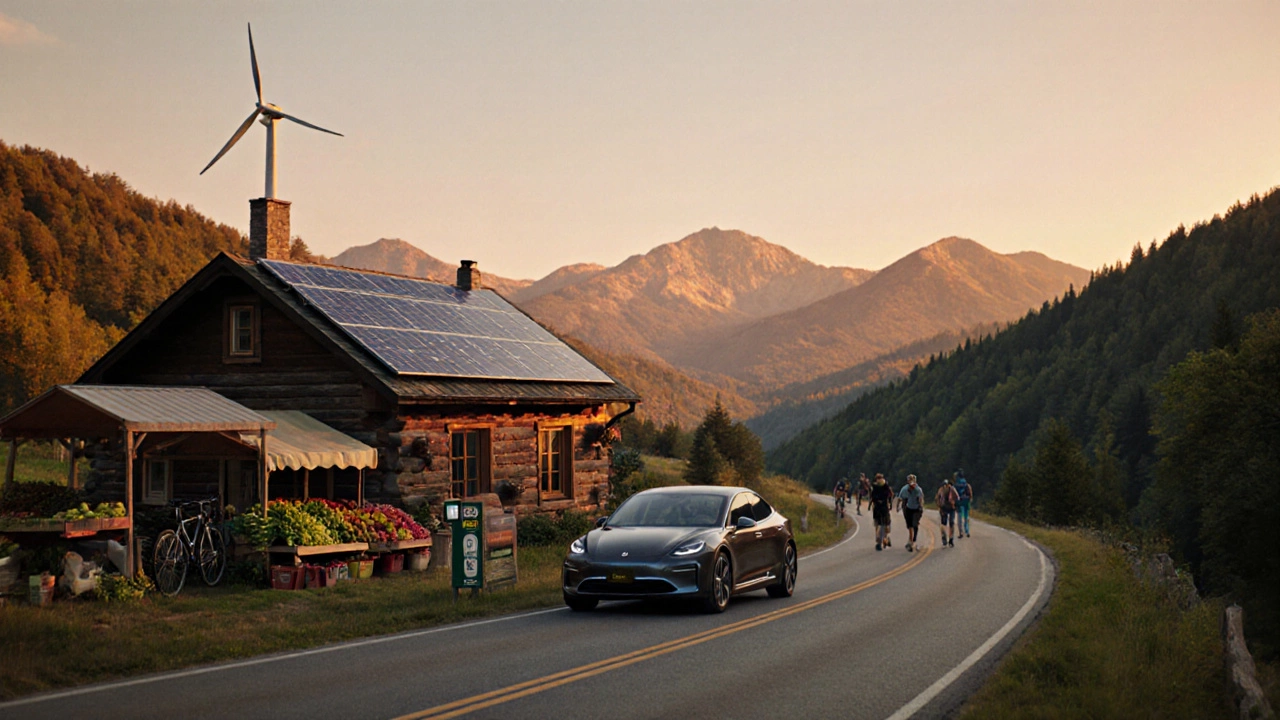
Imagine stepping off a plane and instantly breathing cleaner air, seeing electric buses glide down the streets, and spotting miles of protected forest right outside your window. That’s what the greenest state in the US offers - a blend of clean power, low emissions, and policies that put the planet first. Below we break down how experts measure "green," reveal the top‑ranking state for 2025, and give you the facts you need to plan an eco‑friendly visit.
Quick Takeaways
- Vermont tops the 2025 green‑state ranking thanks to renewable energy, low per‑capita emissions, and the highest share of protected land.
- Washington, Oregon, Colorado, and California round out the top five.
- Key metrics include renewable electricity share, carbon emissions per capita, protected acreage, electric‑vehicle (EV) adoption, and state sustainability policies.
- Travelers can boost their own low‑carbon footprint by choosing public transit, staying in certified eco‑lodges, and supporting local farms.
- All data are sourced from the U.S. Environmental Protection Agency (EPA), U.S. Energy Information Administration (EIA), and the American Council for an Energy‑Efficient Economy (ACEEE).
How We Measure Greenliness
There’s no single definition of “green,” so we built a composite index that balances five hard‑data pillars. Each pillar is weighted to reflect its long‑term climate impact.
- Renewable Energy - the percentage of a state’s electricity that comes from wind, solar, hydro, or geothermal sources. Data from the EIA (2023‑2024) provide the share of renewables in the generation mix.
- Carbon Emissions - metric tons of CO₂ per capita. EPA’s State Greenhouse Gas Inventory supplies the per‑person figure, which normalizes for population size.
- Protected Land - the proportion of state area set aside as national parks, state parks, or conservation easements. The U.S. Forest Service and National Park Service reports are the source.
- EV Adoption - number of registered electric vehicles per 1,000 residents. ACEEE’s annual EV market tracker gives the latest numbers.
- Sustainability Policies - a qualitative score (0‑10) based on state legislation for renewable standards, carbon pricing, and climate‑justice programs. Scores are compiled by the Climate Leadership Council.
Each state receives a normalized score (0‑100) for every pillar, then we calculate a weighted average: renewable energy (30%), carbon emissions (30%), protected land (20%), EV adoption (10%), and policies (10%). The resulting figure is the Green State Index (GSI).
The Top 5 Greenest States in 2025
| Rank | State | Renewable Energy % | CO₂ per Capita (t) | Protected Land % | EVs per 1,000 Residents | Policy Score (0‑10) | GSI |
|---|---|---|---|---|---|---|---|
| 1 | Vermont | 48 | 4.2 | 65 | 38 | 9.2 | 92.4 |
| 2 | Washington | 55 | 4.5 | 58 | 45 | 8.7 | 90.1 |
| 3 | Oregon | 52 | 4.8 | 62 | 42 | 8.5 | 88.7 |
| 4 | Colorado | 46 | 4.9 | 54 | 40 | 8.3 | 86.5 |
| 5 | California | 60 | 5.1 | 51 | 55 | 8.0 | 85.2 |
Vermont edges out the rest thanks to an impressive mix of small‑scale solar, wind farms, and aggressive carbon‑pricing policies that drive per‑capita emissions to just 4.2tons. But the other states each excel in different ways, as the next section shows.
Why These States Lead
Vermont has a statewide renewable portfolio standard of 75% by 2030 and a cap‑and‑trade program that began in 2015. Its dense forest cover means over 65% of land is protected, limiting deforestation and preserving carbon sinks.
Washington benefits from massive hydroelectric capacity (the Grand Coulee Dam alone supplies 30% of state power) and a fast‑growing offshore wind sector. The state’s EV‑charging network covers95% of highways, encouraging low‑emission travel.
Oregon blends wind power along the Columbia River Gorge with aggressive building‑code retrofits that slash residential energy use. Its land‑conservation bonds have doubled park acreage in the last decade.
Colorado leads in solar rooftop adoption thanks to state tax credits, and it has one of the highest per‑capita rates of public transit use among western states. Mountain‑range protection ensures over half the state remains wilderness.
California may not top the list because its sheer population drives higher total emissions, but its renewable electricity share tops the nation at 60% and it boasts the nation’s most extensive EV incentives.

Visiting the Greenest State: Practical Tips
If Vermont’s rolling hills and farm‑to‑table culture call to you, here’s how to keep your trip as low‑impact as the state itself:
- Travel smart: Fly into Burlington International Airport (BTV) and rent an electric car from local providers. The state’s charging stations are clustered around major towns, making day trips easy.
- Stay green: Choose certified Green Hotels™ or eco‑cottage rentals that use solar water heating and composting.
- Eat local: Dine at farm‑direct eateries that source 90% of ingredients within a 30‑mile radius. Look for “Farm‑to‑Table” or “Organic Certified” signage.
- Explore sustainably: Hike the Green Mountain National Forest using marked trails, and pack out all waste. Many towns offer bike‑share programs powered by renewable energy.
- Offset if needed: If you must take a short flight, purchase carbon offsets from vetted NGOs that fund reforestation projects in the Appalachian region.
Similar advice applies to the other top states: use public transit in Seattle, ride the Portland MAX Light Rail, or join a Colorado electric‑bike tour.
Common Misconceptions About “Green” Rankings
People often assume a state with the most solar panels is automatically the greenest. That’s false - overall emissions per capita matter more than total capacity. Another myth is that “big states” can’t be green; California proves that policy ambition and technology can offset sheer size.
Finally, some think “green” only means environmental protection of wilderness. In reality, it also covers social equity, clean‑energy jobs, and climate‑justice legislation, which we factored into the policy score.
Frequently Asked Questions
Which US state has the lowest carbon emissions per person?
Vermont leads with about 4.2metric tons of CO₂ per capita in 2024, thanks to its renewable portfolio standards and aggressive carbon‑pricing.
How does renewable energy share affect a state’s green ranking?
Renewable energy share is weighted at 30% of the Green State Index. Higher percentages reduce reliance on fossil fuels and lower overall emissions, pushing a state higher in the ranking.
Can I travel sustainably within the top green states?
Absolutely. All top‑five states offer extensive EV‑charging networks, bike‑share programs, and public‑transport options powered by clean electricity. Choose eco‑lodges and local food to keep your footprint low.
Why doesn’t California rank #1 despite its renewable power?
California’s massive population inflates total per‑capita emissions, and its protected‑land percentage is lower than the New England states. The index balances size with policy, so California lands at #5.
What data sources are used for the Green State Index?
We combine EPA greenhouse‑gas inventories, EIA renewable‑energy reports, U.S. Forest Service protected‑land statistics, ACEEE EV market data, and the Climate Leadership Council’s policy‑score database.